Trade, Financial Markets & Real Estate
Cheat sheet
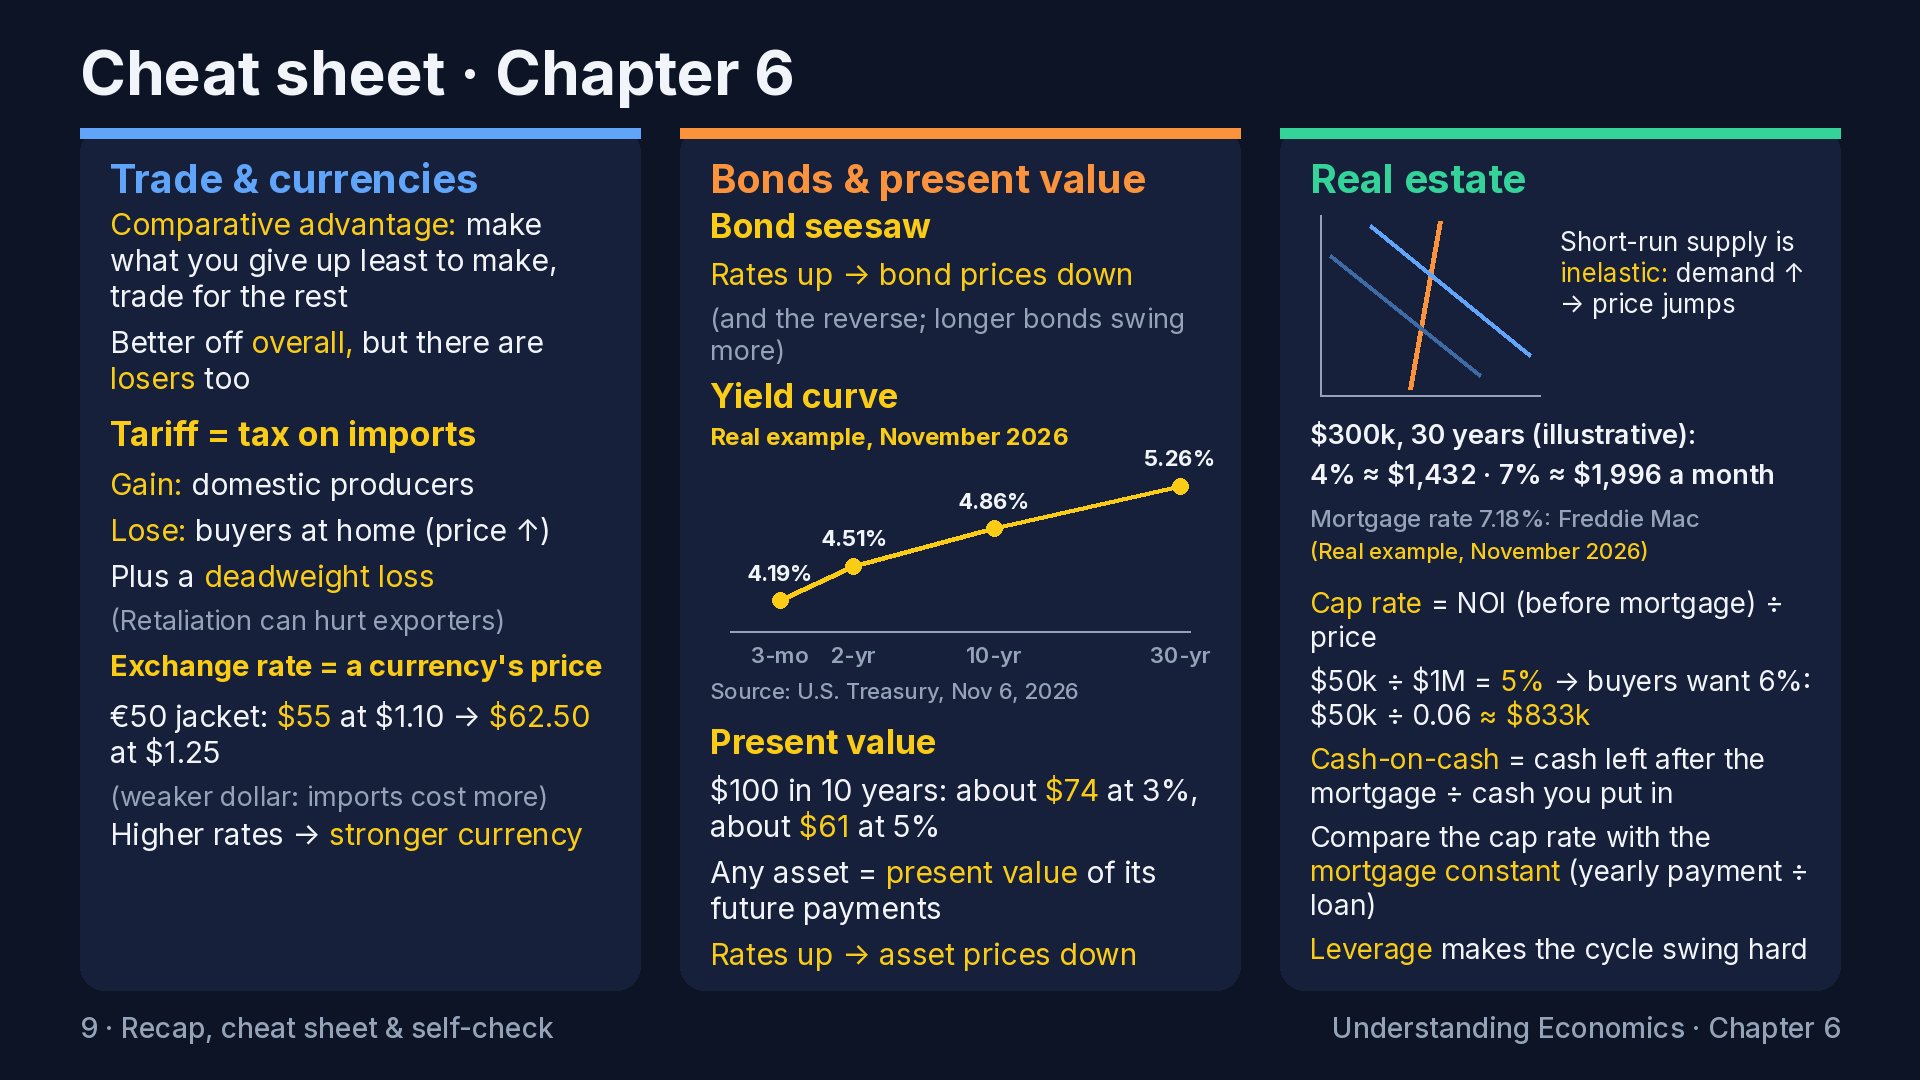
Transcript
The puzzle
Welcome to Chapter 6 of Understanding Economics. In this final chapter, we'll cover why countries trade, then how bonds, stocks and real estate are priced. And we'll see the one idea that links them all: what happens when interest rates move. Here's the last puzzle of the course. Interest rates go up. The next day, stock prices fall. Over the following months, prices of homes and office buildings start to soften too. But think about it. The company has the same products, the same customers, the same workers it had yesterday. The house has the same rooms and the same view. Nothing about the things themselves changed. So why are they suddenly worth less? By the end of this chapter you'll be able to answer that with one simple idea, and you'll see that it ties together trade, stocks, bonds and real estate. It's also where everything in this course comes together.
Why countries trade
Let's start with trade, and go quickly, because you already know the core idea from Chapter 1: comparative advantage. Remember the rule. You don't have to be the best at something to gain from trading it. You just need to give up less to make it than someone else does. A country that's good at making everything still gains by focusing on what it gives up the least to produce, and trading for the rest. Both sides end up with more than they could make alone. Countries trade for the same reason you don't grow your own coffee, sew your own clothes, and fix your own car: specializing and trading is a much better deal. There are a few more reasons on top of that. Some countries have things others simply don't: certain minerals, a climate for growing bananas, a particular kind of skilled workforce. Bigger markets let companies make things at a larger scale, which often brings costs down. And trade brings variety. Lots of trade today is two countries selling each other the same kinds of things: cars for cars, cheese for cheese, because people like choice. Economists call that intra-industry trade. But here's the honest part, and it's important. Trade makes a country better off overall. That doesn't mean it makes everyone better off. Consumers win, through lower prices and more choice. Exporters win, because they have a bigger market. But workers and businesses that compete with imports can lose, sometimes badly. A factory town whose main plant can't compete with cheaper imports doesn't feel better off, and the losses are concentrated in particular places and people. The gains are real but spread thinly across everyone, while the losses are painful and visible. That's why trade is always politically hard, and why many economists argue the winners should help the losers, through things like retraining and support while people find new work.
Tariffs, briefly
A tariff is a tax on imports, and you met it in Chapter 2. As we saw there, a tariff raises the price at home, helps domestic producers, hurts buyers, and creates a deadweight loss. And by the incidence rule from Chapter 2, a large share often lands on buyers at home, even when it's described as the foreign country paying. So let's go straight to what's new here: the trade-offs. Why do countries use tariffs anyway? The usual arguments: protecting jobs in a particular industry; giving a young industry time to grow up before it faces full competition; national security, for things a country doesn't want to depend on others for; and pushing back against another country's unfair practices. Some of these can make sense in specific cases. The common replies: protected jobs often cost consumers far more than the jobs pay; young industries sometimes never grow up; and tariffs invite retaliation, which hurts exporters. Most economists see broad tariffs as costly, while accepting that narrow, targeted ones are a judgment call. One effect people often miss: many imports aren't finished products. They're parts and materials that businesses at home use to make their own goods. A tariff on imported steel helps steel makers, but it raises costs for every business that uses steel, from car makers to the company that builds the shelves at your grocery store. So a tariff meant to protect one industry can quietly hurt others.
Exchange rates, lightly
When you trade across borders, you need another country's money. So currencies have prices too. An exchange rate is just the price of one currency in terms of another. Here's an illustrative example. Say one euro costs a dollar ten. A jacket in Europe that sells for fifty euros costs an American fifty-five dollars. Now say the dollar gets weaker, and a euro costs a dollar twenty-five. The same jacket now costs sixty-two fifty. Nothing about the jacket changed. The currency did. When a currency buys more of other currencies, we say it appreciated, or got stronger. When it buys less, it depreciated, or got weaker. A strong dollar is great if you're an American traveling abroad or buying imports: everything foreign looks cheaper. It's harder on American exporters, because their goods look more expensive to foreign buyers. A weak dollar is the reverse. So what moves exchange rates? Supply and demand for currencies, as you'd guess. And one of the biggest forces connects right to Chapter 5: interest rates. If interest rates in one country rise compared with others, savers around the world want to put money there, to earn the higher rate. To do that, they have to buy that country's currency first. So higher interest rates tend to strengthen a currency. That's one more channel through which a central bank's decisions reach your life: a higher rate can make imports a bit cheaper and exporters a bit less competitive. Not every currency floats freely like this. Some countries fix, or peg, their currency to another one, often the dollar, and their central bank buys and sells to hold the rate in place. A peg gives businesses certainty about prices. The cost is that the central bank has to set its interest rates to defend the peg, rather than to suit its own economy, and if markets stop believing it can hold the line, the peg can break suddenly. One last word you'll hear: the trade deficit. It means a country is buying more from the rest of the world than it's selling. It's not like a business losing money. The other side of a trade deficit is money flowing back in, as foreigners invest in the country's companies, bonds and property. Whether a trade deficit is a problem depends a lot on why it's happening, and economists disagree about how much to worry. That's all we need for now.
Bonds
Now financial markets. There are two big ways for a company or a government to raise money: borrow it, or sell a piece of ownership. Borrowing is a bond. Ownership is a stock. Bonds first, because they make the puzzle easy. A bond is an IOU. You lend money, and the borrower promises to pay you interest on a schedule and pay you back on a set date. You met government bonds in Chapters 4 and 5. Companies sell them too. A company's bonds usually pay more than the government's, because the company is more likely to fail to pay. Agencies grade how risky each borrower is, with credit ratings, and the riskier the grade, the higher the interest the borrower has to offer. It's the risk premium from Chapter 5 again. Every bond has three numbers. The face value is the amount paid back at the end, say a thousand dollars. The coupon is the regular interest payment. Say thirty dollars a year, or three percent of the face value. And the maturity is when it ends, say ten years from now. Here's the key thing about bonds. You don't have to hold one for ten years. You can sell it to someone else along the way, and the price you get depends on interest rates at the time. This is the part to go slowly on. Say you bought that ten-year bond paying thirty dollars a year. Then interest rates rise, and brand-new ten-year bonds now pay fifty dollars a year, five percent, for the same thousand dollars. Now you want to sell your old bond. Who would pay you a thousand dollars for a bond that pays thirty a year, when they could pay a thousand for a new one that pays fifty? Nobody. The only way to sell it is to cut the price, until the old bond's thirty dollars a year, plus its thousand at the end, gives the buyer about the same five percent return as a new bond. Worked out properly, that price is about eight hundred and forty-six dollars. So here's the rule. When interest rates rise, the prices of existing bonds fall. When interest rates fall, existing bonds become more valuable, and their prices rise. Prices and rates move in opposite directions, like a seesaw. And the longer the bond has left to run, the bigger the swing, because the buyer is stuck with the low payments for longer. People also talk about a bond's yield. That's the return a buyer gets at today's price. When the old bond's price fell to eight forty-six, its yield rose to five percent. So "yields rose" and "bond prices fell" are the same news, said two ways. Let's look at a real example. Here's what these numbers looked like in November 2026, when this course was made. They're here to show you how to read the numbers, so focus on what each one means. Now, if you take the yields on government bonds of different lengths and plot them, you get the yield curve. On the slide is the real example: the U.S. Treasury's curve for November sixth, 2026, running from the three-month bill up to the thirty-year bond. It slopes upward: longer loans pay more, which is the normal shape. Remember from Chapter 5: a long rate is roughly the short rates people expect over its life, plus a term premium for tying money up longer. That premium tends to tilt the curve up. Sometimes, though, the curve flips, and short rates end up higher than long ones. That's called an inverted yield curve. It usually means markets expect rates to fall in the future, often because they expect the economy to weaken. In the U.S., an inverted curve has come before many past recessions, though not every inversion has been followed by one, so it's a warning light, not a forecast.
Stocks
A stock, or a share, is a slice of ownership in a company. If a company has a million shares and you own one, you own one millionth of it: one millionth of its factories, its brands, and, most importantly, its future profits. Companies sell shares to raise money to grow, without having to pay it back like a loan. After that first sale, shares mostly trade between investors on a stock exchange, and the company doesn't get money from those trades. It's just one owner selling to another. How does a shareholder get paid? Two ways. Some companies pay out part of their profits as dividends, cash sent to shareholders every so often. Others keep their profits and reinvest them to grow, hoping the company, and so each share, becomes more valuable. Either way, what you're buying is a claim on the company's future profits. That's the heart of how a stock is valued. A share is worth what its future profits are worth today. You'll often hear about something called the price-to-earnings ratio, or P/E: the share price divided by the company's profit per share. If a share costs a hundred dollars and the company earns five dollars a share each year, the P/E is twenty. Illustrative numbers. Roughly, people are paying twenty years' worth of today's profits for the share. A high P/E usually means buyers expect profits to grow a lot. A low one may mean they expect slow growth, or see more risk. Stocks are riskier than bonds. A bond promises fixed payments. A stock promises nothing: profits can rise or collapse, and in a bankruptcy, bondholders get paid before shareholders. So, over long periods, investors have demanded a higher expected return from stocks to make up for that risk. That extra is called the equity risk premium, a cousin of the risk premium from Chapter 5. Expected is the important word. In any single year stocks can fall a lot. Two quick ideas worth knowing. First, diversification: owning a little of many companies instead of a lot of one. If one company fails, it's a small part of what you own. That's why many people buy index funds, which hold a small slice of every company in a broad list, at low cost. Second, it's very hard to beat the market consistently, because prices already reflect what lots of people know. Economists call that the efficient markets idea. It doesn't mean prices are always right. It means mistakes are hard to spot ahead of time and profit from reliably. And notice why stock prices move so much from day to day. It's Chapter 1 again: expectations. A share's price reflects what people expect future profits to be. So news that changes those expectations, a new product, a weak sales report, a change in interest rates, moves the price right away, long before the profits themselves change. It also explains something that confuses people: the stock market and the economy aren't the same thing. The market can rise while the economy is weak, if investors expect things to get better, and it can fall in a good year, if they expect worse ahead.
How interest rates hit asset prices
Now we can crack the puzzle. And it all comes down to one idea: money in the future is worth less than money today. Economists call it the time value of money. Ask yourself: what is a hundred dollars that you'll get ten years from now worth to you today? Less than a hundred, because if you had the money now, you could put it in the bank and earn interest. So the question really is: how much would you need to set aside today, earning interest, to have a hundred dollars in ten years? If interest rates are three percent a year, the answer is about seventy-four dollars. Seventy-four dollars growing at three percent a year for ten years becomes about a hundred. That seventy-four is the present value of the future hundred. Now raise the interest rate to five percent. You need to set aside less, about sixty-one dollars, because it grows faster. So at higher rates, the same future hundred dollars is worth less today. That's the heart of the puzzle in two numbers. The future payment didn't change. The rate used to value it did. The same math works forward, for savers. Money growing at a steady rate compounds: you earn interest on your interest. A handy shortcut, the rule of seventy-two, says that dividing seventy-two by the interest rate gives roughly the years it takes money to double. At six percent, about twelve years. At three percent, about twenty-four. It's the cousin of the rule of seventy from Chapter 4, and it's why starting to save early matters so much. Now apply it to everything. A bond is a stream of future interest payments. A stock is a claim on a stream of future profits. A rental building is a stream of future rents. In this way of thinking, each one is worth the present value of what it will pay you in the future. So when interest rates rise, every future payment is worth less today, and the price of the whole asset falls, even if the payments themselves haven't changed at all. And there's a second force pushing the same way. When safe bonds pay more, the riskier stuff has to offer more too, or why would anyone bother? If a government bond suddenly pays five percent, risk-free, investors demand a higher return from stocks and property before they'll take the extra risk. The only way to raise an asset's return, when its future payments stay the same, is for its price to fall. That's the payoff. Why did the stock, the bond and the house all lose value when rates rose, even though nothing about them changed? Because what something is worth today depends on two things: what it will pay in the future, and the interest rate used to value those future payments. Rates went up, so the same future looks smaller from here. On top of that, higher rates can also slow the economy, as you saw in Chapter 5, which can shrink the future payments themselves. Both effects point the same way. Here's your first check. Pause and predict. Interest rates rise sharply. Company A is a utility company that earns steady profits right now. Company B is a young technology company that isn't profitable yet, but people expect it to make most of its money fifteen years from now. Which stock probably falls more? Pause, think about present value, then come back. The answer: probably Company B. The further away a payment is, the more a change in interest rates shrinks its value today, because the higher rate compounds over more years. Company A's money arrives soon, so higher rates don't shrink it much. Company B's money is far in the future, so it takes the bigger hit. That's why fast-growing companies' stocks often swing more when rates change. It's the same reason a thirty-year bond swings more than a two-year bond.
Real estate economics
Now let's put the whole course to work on one of the biggest markets of all: real estate. It's the perfect final exam, because almost every tool you've learned shows up in it. Start with supply and demand. Housing demand comes from the usual places: how many people live in an area, how many jobs there are, what people earn, and, as we'll see, interest rates. Supply is where housing is unusual. You can't build a house in a week. It takes land, permits, materials, workers and often a year or more. And in many places, land near jobs is scarce and rules limit what can be built on it. So in the short run, housing supply is very inelastic, the term from Chapter 2. When demand rises, say a big new employer moves to town, the number of homes barely changes at first, so prices and rents jump. Over years, builders respond, and supply catches up, if they're allowed to build. That's why the same rise in demand can mean modest price increases in a place with lots of open land and easy permits, and big increases in a place where building is hard. That last point brings in Chapter 3. Zoning and land-use rules decide what can be built where: how tall, how dense, how many units. Many of these rules exist for real reasons, to deal with externalities like traffic, noise or shadows on neighbors. But when they're strict, they act like a limit on supply, and a supply limit with growing demand means higher prices. And Chapter 2 shows up too. A rent cap is a price ceiling. If it's set below the market rent, you'd predict a shortage: more people want apartments at that rent than there are apartments, and over time landlords may have less reason to build or maintain them. Like any policy, its effects depend on how it's designed, and economists argue about the details. The tools tell you what to look for. Here's another thing real estate teaches. Why can the exact same house cost several times more in one city than in another? The building costs about the same to put up in both places. The difference is mostly the land under it, and the land is valuable because of where it is: near jobs, good schools, transport, the coast. Land is the one input whose total supply in a location really can't grow. So when an area gets more attractive, most of the gain shows up in the value of the land. That's the economics behind the old line "location, location, location". And property taxes connect to Chapter 2's lesson on who really pays a tax. A tax on buildings can discourage building, because it's partly a tax on improving property. A tax on the land alone can't shrink the amount of land, so economists have long pointed out that it causes less distortion. How much of a property tax landlords pass on to renters depends, as always, on how sensitive each side is. Rents versus prices. Here's a useful way to see them. The rent is the price of using a home for a month. The price is the price of owning it, which means owning all its future months of use, or all its future rents. And now you know what that means: a home's price is linked to the present value of all its future rents. That's where interest rates come in, and where the puzzle comes back. Most people buy a home with a mortgage, a long loan secured by the home. So for most buyers, the question isn't "what's the price?" It's "what's the monthly payment?" Let's run an illustrative example. Borrow three hundred thousand dollars for thirty years at a fixed four percent, and the monthly payment for principal and interest is about fourteen hundred and thirty-two dollars. At seven percent, the same loan costs about nineteen hundred and ninety-six dollars a month. That's more than five hundred and sixty dollars extra, every month, for thirty years, for the exact same home. Now turn it around. Say a buyer can afford fourteen hundred and thirty-two dollars a month. At four percent that supports a three-hundred-thousand-dollar loan. At seven percent, it supports only about two hundred and fifteen thousand. Same buyer, same income, about a quarter less to borrow. Multiply that across every buyer in a city, and you can see how higher rates push on home prices. Fewer buyers can pay the old prices, so prices tend to soften, or at least stop rising as fast. In the November 2026 example, the average thirty-year fixed mortgage rate was about seven point one eight percent, from Freddie Mac's weekly survey. And you know from Chapter 5 why that rate tends to track the ten-year Treasury yield, which was about four point eight six percent, more than the Fed's own target. A few more mortgage basics, quickly. A fixed-rate mortgage keeps the same rate for the whole loan. An adjustable-rate mortgage starts at one rate and then moves with market rates later, so the payment can rise or fall. And here's an effect that surprises people, called the lock-in effect. When rates rise a lot, homeowners who got low fixed rates years ago don't want to sell, because moving means giving up a cheap mortgage for an expensive one. So fewer homes come up for sale. That can hold prices up even as higher rates push them down, and it freezes the market, with fewer sales on both sides. Now let's look at real estate the way an investor in buildings does, because it shows the puzzle most clearly. For a rental building, people use something called the capitalization rate, or cap rate. It's the building's yearly net operating income, meaning the rent it collects minus operating costs like maintenance, insurance and property taxes, divided by its price. One thing to be clear on: net operating income is before any mortgage payments. The cap rate describes the building, not how the buyer paid for it. Say a small apartment building brings in fifty thousand dollars a year after costs, and it sells for a million dollars. Its cap rate is fifty thousand divided by a million: five percent. Illustrative numbers. Notice what that is. It's the building's yield, just like a bond's yield. You pay a price, and you get a stream of income back. Here's your second check. Pause and predict. Interest rates rise. Bonds now pay more, so buyers of buildings like this one want a six percent return instead of five. The rent and costs don't change: still fifty thousand dollars a year. What happens to the price of the building? Pause, do the division, then come back. The answer: the price falls to about eight hundred and thirty-three thousand dollars. Fifty thousand divided by six percent. The building is exactly the same. Same tenants, same rent. But to give a buyer a six percent return on the same income, the price has to drop by about a sixth. That's the bond seesaw from section 5, the present-value idea from section 7, and the puzzle, all in one building. Cap rates tend to rise when bond yields rise, because property has to compete with bonds for investors' money. The gap between a cap rate and the ten-year Treasury yield is partly extra pay for property's risk and for being harder to sell quickly than a bond. But it also reflects what buyers expect from rents: if they expect income to grow, they'll accept a lower cap rate today. So the gap is a useful gauge, not a pure measure of risk. The cap rate tells you about the building. A buyer also wants to know about their own money, and for that there's a second measure: cash-on-cash return. It's the cash you have left each year after the mortgage payments, divided by the cash you actually put in. Same illustrative building. Pay all cash, and the two measures match: five percent. Now put five hundred thousand down and borrow the other five hundred thousand at six percent for thirty years. The mortgage payments come to about thirty-six thousand a year, which leaves about fourteen thousand. Fourteen thousand on five hundred thousand invested is about two point eight percent. Part of those payments pays down the loan, which builds your equity, but cash-on-cash only counts the cash in your pocket. Same building, same five percent cap rate, and borrowing pulled the cash return down. What decides it isn't just the interest rate. It's the full yearly mortgage payment as a share of the loan, which is called the mortgage constant. Here that's about seven point two percent, because every payment also pays down some of the loan. If the mortgage constant is below the cap rate, borrowing pushes your cash return up. Above it, borrowing pulls it down. Even a four percent loan has a mortgage constant of about five point seven percent, so here it would still pull the cash return down, to about four point three percent. Inflation and real estate is the other side of the coin. Property is a real asset: when prices in general rise, rents and replacement costs tend to rise too, over time. And someone with a fixed-rate mortgage gets a bonus you saw in Chapter 4: inflation means they pay back the loan in dollars that are worth less. The catch is that inflation usually brings higher interest rates, which, as you've just seen, push property prices the other way. So property can be a decent shield against inflation over long periods, but rarely a smooth one. Finally, real estate moves in cycles, and it often swings harder than the overall economy. Here's the typical pattern. Demand rises, and credit is easy. Prices climb. Builders start lots of projects, but they take years to finish. By the time they're done, demand may have cooled, or rates may have risen, and suddenly there's too much supply. Prices fall and building stops. Then, slowly, demand catches up, and it starts again. The lag between deciding to build and finishing is what makes the swings big. And credit is the amplifier. Most property is bought with a lot of borrowing. That's called leverage. Leverage makes gains bigger on the way up and losses bigger on the way down. Say you buy a home with ten percent down. If its price rises ten percent, you've roughly doubled your money. If it falls ten percent, your entire down payment is gone, before counting costs. The financial crisis of 2008 is the cautionary tale, and it pulls in this whole course. During the housing boom of the early and mid-2000s, many loans were made to borrowers who couldn't really afford them, often with little checking of income. That's a hidden-information problem from Chapter 3. Many of those loans were bundled into securities and sold to investors around the world, so the lender who made the loan often didn't keep the risk. That's moral hazard. When home prices stopped rising and began to fall, many borrowers couldn't pay, the securities lost value, and banks that held them, often with lots of leverage, got into deep trouble. Credit froze, and the economy fell into a severe recession. The Fed cut rates to near zero and used the emergency tools from Chapter 5. That's a simplified version of a very complicated story, but the core is clear: leverage plus hidden risk plus falling prices. One last practical note: renting versus buying. It's not true that renting is always throwing money away, and buying isn't always the smart move. Buying means paying interest, property taxes, insurance and maintenance, and tying up savings in a down payment that could have earned a return elsewhere. That's opportunity cost, from Chapter 1. Renting means paying a landlord, but with flexibility and no big upfront bet. Which is better depends on how long you'll stay, the price compared with rent where you live, interest rates, and your own situation. The tools from this course tell you which questions to ask.
Recap, cheat sheet & self-check
Let's lock in this chapter, and then the whole course. Countries trade because of comparative advantage. Trade makes a country better off overall, but it creates losers as well as winners. A tariff is a tax on imports. Buyers at home pay more, domestic producers gain, and there's a deadweight loss. An exchange rate is the price of a currency. Higher interest rates tend to strengthen a currency. A bond is a loan. When interest rates rise, existing bond prices fall: the seesaw. A stock is a slice of ownership in a company's future profits, riskier than bonds, with a higher expected return. Any asset is worth the present value of its future payments. Higher interest rates make future payments worth less today, so stock, bond and property prices tend to fall. Real estate has slow, inelastic supply, so demand shifts move prices a lot. Mortgage rates set what buyers can afford, cap rates behave like bond yields, and leverage makes the cycle swing hard. Here's your cheat sheet. On the left, trade and tariffs. In the middle, bonds, the yield curve and present value, the idea behind the price of any asset. On the right, the real estate tools: inelastic supply, the payment table, and the cap rate versus cash-on-cash. If you remember one line from this chapter, make it this one: what anything is worth today depends on what it will pay you later, and on the interest rate used to value it. Now three questions to check yourself. Pause after each one, answer out loud, then let it play. Question one. You own a bond that pays four percent. Interest rates on new bonds fall to two percent. What happens to the price of your bond, and why? Answer. It rises. Your bond pays more than any new bond, so buyers will pay more than face value to get it. Rates and bond prices move in opposite directions. Question two. A government puts a tariff on imported washing machines. Name one group that gains and one that loses. Answer. Domestic washing machine makers gain, and so may their workers, because they face less competition and can charge more. Buyers lose, because they pay more for washing machines, whether imported or made at home. And the economy as a whole loses a little through the deadweight loss. Exporters could also lose, if other countries retaliate. Question three. A city's population grows quickly, but strict rules make it very hard to build new homes. A few years later, interest rates fall. What do you predict for home prices, and why? Answer. Prices rise, probably a lot. Demand rises with the population, and with supply held almost fixed, the extra demand goes mostly into price instead of new homes. Lower rates then make monthly payments cheaper, so buyers can afford to pay more, pushing prices up further. Inelastic supply, plus rising demand, plus falling rates: all three point the same way.
Course wrap-up
And that's the Understanding Economics. Let's look at the whole thing on one page. In Chapter 1, you learned that economics is the study of choices under scarcity, that every choice has an opportunity cost, and that prices come from supply and demand. In Chapter 2, you saw how markets really work: how sensitive buyers are to price, what happens when a government caps a price or adds a tax, and why one seller can charge more than many. In Chapter 3, you saw where markets go wrong: side effects like pollution, things people can use without paying, and hidden information. And you saw how wages get set. In Chapter 4, you zoomed out to the whole economy: how we measure output, jobs and prices, what recessions are, and what governments do with spending, taxes and debt. In Chapter 5, you met money, banks and the central bank, and followed one interest-rate decision all the way to your loans and savings. And in this chapter, you took it out into the world: trade, currencies, stocks and bonds, and finally real estate, where most of the tools came together. If you look back, a handful of ideas did almost all the work. Opportunity cost. Thinking at the margin. Supply and demand, and what shifts them. Real versus nominal. Incentives. And now present value. Those six will get you through most of the economic news you'll ever read, and a lot of your own money decisions too. The best way to make this stick is to use it. Next time you see a headline about prices, jobs, rates or the housing market, pause and ask the questions this course taught you. Did supply shift, or demand? Is that number real or nominal? Was that rate move a surprise? What would this be worth today? You'll be surprised how often you know the answer. Thanks for watching all six chapters. Go and put it to work.
Downloads
Figures in this course are illustrative unless a source is cited. Real-world data reflects conditions as of November 2026. Narration is AI-generated.
Check your understanding
10 questions on Chapter 6. Pick an answer to see why; tap a section to jump the video there.
Want another course? Suggest a course