Foundations, Supply & Demand
Cheat sheet
Transcript
The puzzle & what economics is
Welcome to Chapter 1 of Understanding Economics. In this chapter, we'll see what economics really studies, why every choice has a cost, and how a country decides what to make. Then we'll build the most useful tool in the course: supply and demand, and how the two meet to set a price. Let's start with a puzzle. Picture this. A hugely popular artist announces a tour. Tickets go on sale at ten in the morning. By one minute past ten, every seat is gone, and thousands of fans are left staring at a sold-out screen. An hour later, those same seats show up on resale sites for three times what they cost. So what happened? If people were willing to pay that much, why were the tickets so cheap to begin with? And why did they vanish so fast? By the end of this chapter, you'll be able to explain the heart of it with one simple picture. To crack that puzzle, we need a few building blocks, so let's start right at the beginning. So, what is economics? Most people think it's about money, or the stock market, or charts on the news. Those are part of it. But at its core, economics is the study of choices. Specifically, it's the study of how people make choices when they can't have everything they want. You have a limited amount of money and a limited number of hours in the day. So does a business, and so does a country. Economists call that limit scarcity. Almost everything else in economics, prices, jobs, trade, inflation, interest rates, grows out of that one simple fact: we want more than we can have, so we have to choose. Economics comes in two zoom levels. Microeconomics is the zoomed-in view. It looks at individual people, individual businesses, and single markets. Micro asks questions like: why does a latte cost five dollars? How many workers should a bakery hire? Why do some concert tickets sell out in a minute? Macroeconomics is the zoomed-out view. It looks at the whole economy at once. Why are prices rising almost everywhere at the same time? Why is unemployment going up? What is the central bank doing with interest rates? This chapter is mostly micro, because you can't understand the big picture until you understand how one market works.
Scarcity & choices
Section two. Scarcity, opportunity cost, and thinking at the margin: simple ideas that everything else builds on. We've met scarcity already: there isn't enough of everything for everyone to have all they want. Not enough time, money, land, workers, or materials. Even a billionaire has only twenty-four hours in a day. And scarcity isn't the same as poverty. A rich country faces it too, just at a higher level. And because things are scarce, every choice means giving something else up. Choosing one thing is always, quietly, choosing not to do something else. That's a trade-off, and economists have a precise name for what you give up. Opportunity cost. The opportunity cost of any choice is the value of the next-best option you gave up to make it. Not every option you could have picked. Just the best one you said no to. This is probably the most useful idea in this whole chapter, so let's make it real. Say a friend invites you to a concert on Saturday night. The ticket is eighty dollars. Most people would say the concert costs eighty dollars. But suppose your next-best option was picking up a shift at work that night, and that shift would have paid you a hundred and twenty dollars. Then the real cost of going is the eighty you spend, plus the hundred and twenty you didn't earn. Two hundred dollars. That doesn't mean don't go. It means go if the night is worth two hundred dollars to you. If it is, great, that's a good choice. The point is to see the full cost, not just the price on the ticket. Once you start looking, opportunity cost is everywhere. Time is the big one. College costs tuition, sure, but it also costs the wages you could have earned in those years. For many people it still pays off, but the honest comparison includes both. Money has an opportunity cost too. Cash sitting in a drawer feels free, but it's quietly giving up whatever it could have earned in a savings account. Even space. Every store shelf that holds one brand of cereal is a shelf that can't hold something else. Every yes is a no to something else. The next idea is thinking at the margin. In economics, marginal just means one more. The next cup, the next hour, the next worker, the next dollar. Most real decisions aren't all or nothing. They're a little more or a little less. And the rule is simple. Do the next one if the extra benefit is bigger than the extra cost. Not the average benefit. The extra. The flip side is ignoring sunk costs. A sunk cost is money or time you've already spent and can't get back. Say you bought a movie ticket, and twenty minutes in, the movie is terrible. The ticket money is gone whether you stay or leave. So the only question is whether the next hour is better spent here or somewhere else. Look only at what changes from here. Here's the margin in action, with made-up numbers. A coffee shop closes at eight and is thinking about staying open later. Each extra hour costs forty dollars for the staff's wages and the lights. On top of that come the beans, milk and cups for every drink they sell, which run about a fifth of sales. From eight to nine, they'd sell an extra ninety dollars' worth of coffee. The extra cost is forty, plus eighteen for beans, milk and cups: fifty-eight. Ninety beats fifty-eight. Stay open. From nine to ten, sales drop to fifty-five dollars, because fewer people want coffee that late. The extra cost is forty plus eleven: fifty-one. Fifty-five is still a little more. Stay open, barely. From ten to eleven, only thirty dollars of sales. The extra cost is forty plus six: forty-six. That's more than the thirty coming in. Close at ten. Notice they never asked whether the whole day is profitable. They asked about each extra hour, one at a time. That's thinking at the margin, and businesses, workers and governments do it constantly. Last idea in this section. People respond to incentives. An incentive is anything that makes a choice more rewarding or more costly. A bonus, a fine, a sale, a tax, a discount for paying early. And the biggest incentive in the economy is price. When the price of something goes up, people look for ways to use less of it, and producers look for ways to make more of it. When gas gets expensive, people drive less and buy more fuel-efficient cars. One warning. People respond in ways you might not have planned. Imagine a company that pays its customer service team by the number of calls they finish per hour. The calls get faster, sure. But some reps start rushing customers off the phone before their problem is fixed. Whenever you see a new rule or a new price, ask: what will people do differently now? Three quick ground rules for how economists think. First, they use models. A model is a simplified picture of the world, like a map. A map that showed every tree would be useless. Supply and demand is a model. Second, ceteris paribus. It's Latin for all else equal. When we ask what a higher price does, we hold everything else still, so we can see one effect at a time. Third, positive versus normative. A positive statement is about what is, and you can test it with evidence. Higher cigarette taxes reduce smoking. That's a claim you can check. A normative statement is about what should be. The government should tax cigarettes more. That's a value judgment. Keeping the two apart makes you a much clearer thinker.
Economic systems & the circular flow
Section three, quickly: how a whole society organizes its choices. Every society faces scarcity, so every society has to answer three questions. What should we produce? How should we produce it? And who gets it? Economic systems are just different ways of answering. In a traditional economy, the answers come from custom. You farm because your parents farmed. In a command economy, the government decides. Planners choose what factories make, how much, and who gets it. In a market economy, nobody is in charge. Millions of buyers and sellers make their own choices, and prices coordinate all of it. We'll see how in a few minutes. And in practice, almost every country today is a mixed economy. Mostly markets, plus a government that sets rules, enforces contracts, and provides some things directly, like roads, schools and national defense. Countries differ in the mix, not in whether they mix. Now, what does an economy actually use to make things? Economists name four ingredients, called the factors of production. First, land, meaning any natural resource: soil, water, oil. What land earns is called rent. Second, labor. People's time and effort. It earns wages. Third, capital. Not money in a bank, but things made to help make other things, like an espresso machine or a delivery truck. It earns interest. And fourth, entrepreneurship. The person who brings the other three together and takes the risk. What they earn, if it works, is profit. Now the whole economy in one picture: the circular flow. There are two players. Households, that's all of us as people. And firms, that's businesses. They meet in two markets. In the market for goods and services, firms sell coffee, phones and haircuts, and households buy them. Goods flow one way, and our spending flows the other way, becoming the firms' revenue. In the market for the factors of production, the roles flip. Households sell their labor, land and capital, and firms buy them. Money flows back to households as wages, rent, interest and profit. So look at the loop. Your spending becomes a business's revenue. That revenue becomes someone's paycheck. And that paycheck becomes spending again. One person's spending is another person's income. Hold on to that idea, because it's the doorway to chapter four, where we start zooming out to the whole economy.
The production possibilities frontier
Section four. The production possibilities frontier. It sounds fancy, but it's really just a picture of trade-offs. Imagine a small country that can only make two things: food and phones. It has a fixed amount of land, workers, and machines. If it puts everything into food, it can grow a hundred tons and make zero phones. That's option A. Now it starts shifting resources into phones. Option B: ten thousand phones, and food only drops to ninety tons. C: twenty thousand phones and seventy tons of food. D: thirty thousand and forty tons. And E, all phones, forty thousand, and no food at all. Look at what each extra batch of phones costs. The first ten thousand cost only ten tons of food. The next ten thousand cost twenty, then thirty, then forty. Why does it keep rising? The first workers you move into phones are the ones who are great with electronics and not much use on a farm. By the end, you're pulling your best farmers off the land. That's called increasing opportunity cost. Plot those options and you get this curve. It's called the production possibilities frontier, or PPF. Phones along the bottom, food up the side. The curve shows the most of both goods this country can make with what it has. Every point on the curve, like options A through E from our table, is efficient. The country is using everything it has, so it can't make more of one good without making less of the other. A point inside the curve, call it X, means something is being wasted: workers without jobs, factories sitting idle. That's what a recession looks like, and we'll get to those in Chapter 4. And a point outside the curve, call it Y, is impossible with today's resources. Notice the curve bows outward. That's the increasing opportunity cost from the table: the further you push toward phones, the more food each extra phone costs. So how could the country ever reach a point like Y? Growth. More workers, more machines, more education, or better technology, and the whole frontier shifts outward. Now Y is within reach. That sets up a trade-off between today and tomorrow. Put more resources into machines and research now, and you have less to enjoy today, but the frontier grows faster, so you can have more of everything later.
Comparative advantage
Section five. Comparative advantage. One of the most surprising ideas in economics. Meet Maya and Leo, two workers at a café. In one hour, Maya can make thirty sandwiches, or sixty coffees. Leo, in one hour, can make ten sandwiches, or forty coffees. Notice Maya is faster at both. Economists call that absolute advantage. So should Maya do all the work and send Leo home? The answer is no, and the reason is opportunity cost again. Let's price each task in what it gives up. For Maya, one sandwich takes as long as two coffees. So a sandwich costs her two coffees, and a coffee costs her half a sandwich. Now Leo. One sandwich takes him as long as four coffees. Expensive. But one coffee costs him only a quarter of a sandwich. Cheap. So who should do what? Whoever gives up the least. Maya gives up less to make sandwiches: two coffees, versus Leo's four. Leo gives up less to make coffee: a quarter sandwich, versus Maya's half. That's comparative advantage. It's not about who's better. It's about who gives up less. Say each works two hours. If they each split their time evenly, the café gets forty sandwiches and a hundred coffees. Now let them specialize. Leo spends both hours on coffee: eighty coffees. Maya spends an hour and a half on sandwiches, that's forty-five, and half an hour on coffee, that's thirty more. Total: forty-five sandwiches and a hundred and ten coffees. More of both, from the same two people working the same hours. That extra output is called the gain from trade. This scales up to everything. A top lawyer might type faster than her assistant, but she still hires one, because an hour of her time is worth far more doing legal work. It's also the core reason countries trade. Each country does best making what it gives up the least to make, and trading for the rest. And just like Maya and Leo, both sides can win even when one is better at everything. One honest caveat. Trade grows the total pie, but not every slice. Workers and companies that compete with imports can lose out, even while the country as a whole gains. We'll come back to that in Chapter 6.
Demand
Section six. Demand. Now we slow down a little, because this is half of the machine that makes prices. Demand is how much of something people are willing and able to buy, at each possible price. Willing, meaning they actually want it. And able, meaning they can pay. Wanting a sports car doesn't count as demand unless you can afford one. And notice, demand isn't one number. It's a whole list. At this price, people want this many. At a higher price, fewer. That list, drawn as a picture, is the demand curve. Let's make it concrete. Picture the coffee market in a small town. This table is called a demand schedule. At three dollars a cup, people in town would buy fourteen hundred cups a day. At three fifty, twelve hundred. All the way up to five dollars a cup, where they'd only buy six hundred. See the pattern. Every time the price goes up, the number of cups people want goes down. Some people make coffee at home, some switch to tea, some just have one cup instead of two. Put these points on a graph, connect them, and you've drawn a demand curve. Here it is. Price goes up the side, and the number of cups people want goes along the bottom. The curve slopes down. That's the law of demand: when the price goes up, people want less of it. When the price goes down, they want more. Why does it slope down? Two reasons. First, the substitution effect. When coffee gets pricier, people switch to tea, energy drinks, or brewing at home. Second, the income effect. A higher price eats more of your budget, so you can afford less of it. Both push the same way. Now the most important idea in this section, and the one that trips up a lot of people. There are two completely different ways the amount people want can change. The first is a movement along the curve. The price drops, we slide from point A to point B, and people buy more. Nothing changed except the price. Economists call this a change in quantity demanded. The second is when the whole curve shifts. Something other than price changed. Say a big office building opens downtown, full of tired workers. Now, at every single price, people want more coffee. The entire curve moves right. That's called a change in demand. And it can shift left. Say a large employer in town closes. At every price, fewer cups are wanted. The whole curve moves left. Here's the trap. A good's own price never shifts its own demand curve. A price change moves you along the curve. Only outside forces shift it. Along the curve means price. Shift means something else. So what are those outside forces? There are five main ones. First, income. When incomes rise, people buy more of most things, like restaurant meals and new clothes. Those are normal goods. But some things people buy less of as they get richer, like the cheapest instant noodles, because they trade up. Those are inferior goods. Inferior doesn't mean bad quality. It just means demand falls as income rises. Second, the number of buyers. More people in the market means more demand. A new office building, a college opening, a town growing. Each shifts demand to the right. Third, the prices of related goods. We'll unpack that in a second. Fourth, tastes. If a health study says coffee is good for you, or a new drink goes viral online, people want more of it at every price. Demand shifts right. And fifth, expectations. If people expect the price of something to jump next month, some buy it now. If shoppers hear that phone prices are about to go up, more of them buy this month. The expectation of a future price shifts demand today. Related goods come in two flavors. Substitutes are things you use instead of each other, like coffee and tea. So if the price of tea goes up, some tea drinkers switch to coffee. The price of the substitute went up, so demand for coffee shifts right. Note what happened: tea's price moved tea along its own curve, but it shifted coffee's whole curve. Complements are the opposite: things used together, like cars and gas. If gas gets much more expensive, people want fewer big, thirsty cars. The price of the complement went up, so demand for those cars shifts left. Quick check before we move on. The price of tea jumps. What happens to the demand curve for coffee? Pause the video here if you want to think about it. It shifts to the right. Tea is a substitute for coffee, and it just got more expensive. So at every coffee price, more people want coffee. Not a movement along the curve. A shift. Nice.
Supply
Section seven. Supply. The other half of the machine. Let's add the sellers, the cafés in our town. Here's a new column: cups offered. At three dollars a cup, the cafés together would only offer six hundred cups a day. As the price rises, more cups get offered. At five dollars, fourteen hundred cups. That's the supply schedule, and if you plot it, you get a curve that slopes up. And notice something about one row. At four dollars, the number of cups wanted and the number offered are exactly the same. A thousand and a thousand. Hold that thought. It's the heart of part eight. Supply is the seller's side. How much of something sellers are willing and able to offer at each possible price. And the curve slopes up. That's the law of supply. When the price goes up, sellers want to offer more. Think about it from a café's point of view. At a low price, it's barely worth staying open in the slow hours, or hiring another barista. At a high price, cafés open earlier, stay open later, add a second espresso machine. And the corner bakery starts selling coffee too. The logic is profit. The higher the price, the more it pays to sell, so existing sellers offer more, and new sellers show up. Same rule as demand. If only the price changes, you slide along the supply curve. That's a change in quantity supplied. But if something else changes, the whole curve shifts. Say three new cafés open in town. Now, at every price, more cups are offered. Supply shifts right. And if something makes it costlier to make coffee, say the price of coffee beans spikes, every cup becomes less profitable at any given price. Cafés offer less at every price, and the curve shifts left. Here are the main supply shifters. First, input prices: everything a seller has to buy to make the product. For a café, that's beans, milk, wages and rent. When inputs get more expensive, supply shifts left. When they get cheaper, it shifts right. Second, technology. Anything that makes it cheaper to produce shifts supply to the right. Third, the number of sellers. More cafés means more supply. Fewer cafés, less. Fourth, expectations. This one's sneaky. If sellers expect higher prices later, some hold back now. A farmer who expects wheat prices to rise next month might store grain instead of selling it today. That shifts today's supply left. Fifth, government. A tax on each unit sold works like a higher cost, so supply shifts left. A subsidy, where the government pays producers, shifts it right. And sixth, other uses of the same resources. A farmer's field can grow corn or soybeans. If soybean prices shoot up, some farmers switch, and the supply of corn shifts left, even though nothing about corn changed. Quick check. A new espresso machine lets cafés make coffee twice as fast, at the same cost. What happens to the supply curve for coffee in our town? Pause if you want. It shifts right. That's technology. Each cup just got cheaper to make, so at every price, cafés offer more. A shift, not a slide along the curve.
Equilibrium
Section eight. Equilibrium. This is the deep one. We'll slow way down and build it step by step, and by the end, you'll be able to solve our concert ticket puzzle. Let's put the two halves together. Here's demand, the buyers. Coffee drinkers want more cups when the price is lower. And here's supply, the sellers. Cafés offer more cups when the price is higher. Where they cross is called equilibrium. At that one price, the amount buyers want is exactly the amount sellers offer. Economists label it P star, the equilibrium price, and Q star, the equilibrium quantity. In our town, that's four dollars a cup, and a thousand cups a day. And nobody sets it. Not the mayor, not one café. The market finds it on its own. Let's see how. First, what happens if the price is too low? Say every café charges three dollars. At three dollars, buyers want a lot of coffee. That's Q d, quantity demanded. But at that low price, cafés only offer Q s, quantity supplied. Buyers want more than sellers offer. That gap is called a shortage. What does a shortage look like in real life? Long lines. Things selling out. Customers leaving empty handed. And sellers noticing that they could charge more and still sell every cup. So the price starts to rise. And watch what happens at each step up. Some buyers drop out, so quantity demanded falls. And sellers offer more, so quantity supplied rises. The gap gets smaller. And it keeps going until the gap closes, right back at equilibrium. No one had to plan this. The shortage itself pushed the price up. Now the opposite. Say the price is too high, five dollars a cup. Cafés would love to sell lots of coffee at five dollars, so they offer Q s. But buyers only want Q d. Sellers offer more than buyers want. That gap is a surplus. In real life, a surplus looks like unsold stock, empty tables, and suddenly, discounts and happy hour deals. Sellers compete for the buyers who are left by cutting prices. So the price falls, buyers come back, sellers cut back, and the surplus shrinks until it's gone. Back at equilibrium again. Same thing in numbers, from our table. At three fifty, buyers want twelve hundred cups, but cafés offer only eight hundred. A shortage of four hundred cups a day. At four dollars, a thousand wanted and a thousand offered. Equilibrium. At four fifty, cafés offer twelve hundred, but buyers want only eight hundred. A surplus of four hundred. Only one price clears the market, meaning it leaves no shortage and no surplus. Every other price creates a gap, and the gap pushes the price back toward four dollars. So here's the core rule. A shortage pushes the price up. A surplus pushes the price down. And this is why economists get so excited about prices. A price is a signal. A rising price tells buyers, use less of this, and tells sellers, make more of this. A falling price says the opposite. Millions of people, each looking at prices and following their own interest, end up coordinating without anyone in charge. Economists have come to call this the invisible hand, a phrase borrowed from Adam Smith, the eighteenth-century thinker often called the father of economics. Now the really useful part. What happens when something in the world changes? There's a simple four-step method. Step one, draw the market the way it is now, with its equilibrium. Step two, ask: does this event change how much buyers want at each price, or how much sellers offer at each price? Demand, supply, or both? Step three, which direction? Right means more at every price. Left means less. And step four, find the new crossing, and read off what happened to the price and the quantity. Let's run it. Event one. A big office building opens downtown, with a couple thousand new workers. Step one, here's the market today, at E one. Step two. Who does this affect? Buyers. More people who want coffee. At every price, more cups are wanted. So step three, demand shifts right. Step four, find the new crossing, E two. The price went up, and the quantity sold went up. Here's the logic: at the old price there was suddenly a shortage, lines out the door, so the price rose, and the higher price pulled more coffee onto the market. Demand rising means price up and quantity up. Both arrows point the same way. Event two. A bad harvest makes coffee beans much more expensive. Step one, the market today. Step two, who does this affect? Sellers. Their costs just went up. So step three, at every price, cafés offer less. Supply shifts left. Step four, the new crossing. The price goes up, but the quantity sold goes down. That's the signature of a supply drop: price up, quantity down. You've seen this at the gas pump. When a refinery shuts down or oil supplies are disrupted, the supply of gasoline shifts left, and prices jump even though nobody suddenly wants to drive more. Here's a useful trick. You can run the method backwards. If you know what happened to price and to quantity, you can work out which curve moved. If demand rose, price and quantity both go up. If demand fell, both go down. Demand moves them in the same direction. Supply moves them in opposite directions. If supply rose, price goes down and quantity goes up. If supply fell, price goes up and quantity goes down. So when you read that prices for something jumped while fewer were sold, that's not a buying frenzy. It's most likely a supply problem. But careful: if supply and demand both shifted, price and quantity alone can't tell you exactly what happened. And that's our next case. Now the hard case, and the one that matters most in real life, because things rarely change one at a time. What if both curves move? Take the first row: demand rises and supply rises. Both push the quantity up, so quantity definitely goes up. But on price, they fight. More demand pushes it up, more supply pushes it down. So the price could go either way. Second row. Both fall. Quantity definitely goes down. Price, again, it depends. Rows three and four flip it. When demand and supply move in opposite directions, they agree on price. Demand up and supply down both push price up. Demand down and supply up both push price down. But now quantity is the tug of war. So here's the rule. When both curves move, you can know one answer for sure. The other answer depends on which shift is bigger. Let's see that tug of war on a graph. Here's a market where demand and supply are both about to shift right. Think of a town that's growing, so more coffee drinkers arrive, and at the same time, new cafés are opening. If demand's shift is bigger, the new crossing is higher. The price rises, and more cups are sold. If the shifts are about equal, the price ends up roughly where it started, but a lot more coffee gets sold. And if supply's shift is bigger, the price actually falls, even though demand went up. That surprises people. Demand grew, and prices dropped? Yes, because supply grew even more. Quantity went up in all three. Price was the tug of war, and the bigger shift won. Now one bigger story, from a market where supply is slow: apartments. This is a made-up city, call it Boomtown, but the pattern is a common one. In year zero, the apartment market is in balance. Notice the supply curve is steep, because a new building takes years to plan and build. Then demand surges. A wave of jobs arrives, and people move in. Demand shifts right. But because supply is so steep, the quantity barely changes, and rents jump. Now those high rents do their job as a signal. Builders see them and rush to start new projects. A few years later, those projects all finish around the same time. Supply shifts right, a lot. Now the supply shift is bigger, so rents flatten or even dip, while the number of apartments rented goes way up. The tug of war again, playing out over time. The lesson goes beyond housing. Demand can move fast, but supply often moves slowly, because building, hiring and planting all take time. So a price that's rising today isn't a forecast. High prices pull in new supply, and the response is coming. We'll come back to housing in Chapter 6. Now we can solve our puzzle. Let's draw the market for one sold-out concert. Supply is the number of seats, and that's fixed. The arena holds what it holds, whatever the price. So the supply curve is a straight vertical line. Demand is the usual downward-sloping curve: thousands of fans, each with a top price they'd be willing to pay. Where the two cross is the market-clearing price, call it P star. At that price, the number of fans who want a ticket exactly matches the number of seats. But suppose the tickets go on sale at a face value well below P star. Maybe the artist wants to keep the show affordable. Whatever the reason, at that low price, far more people want tickets than there are seats. That's a shortage. Everything is gone in a minute, and a crowd of fans is left empty-handed. And here's the payoff. The shortage doesn't disappear when the box office sells out. Fans who missed out are still willing to pay more, so on the resale market, prices climb toward P star, the price the market would have set in the first place. That's the core reason tickets can vanish in a minute and then show up for triple the price. Same machine as our coffee market: the price was set below equilibrium, and the market found its way back. Real ticket sales have extra wrinkles, like fees and buying bots, but this is the engine underneath. And this same model helps explain a huge range of markets. Take jobs. A wage is just the price of labor. Workers supply labor, employers demand it. If a skill is scarce and lots of companies want it, the wage for that skill rises. The stock market too. A share's price is simply where buyers and sellers meet. Good news about a company shifts demand for its shares right, and the price rises. If a company issues lots of new shares, that adds supply. And in all of these, expectations are huge. People buy and sell based on what they expect to happen next, so prices often move on news before anything has actually changed.
Recap & where we're going
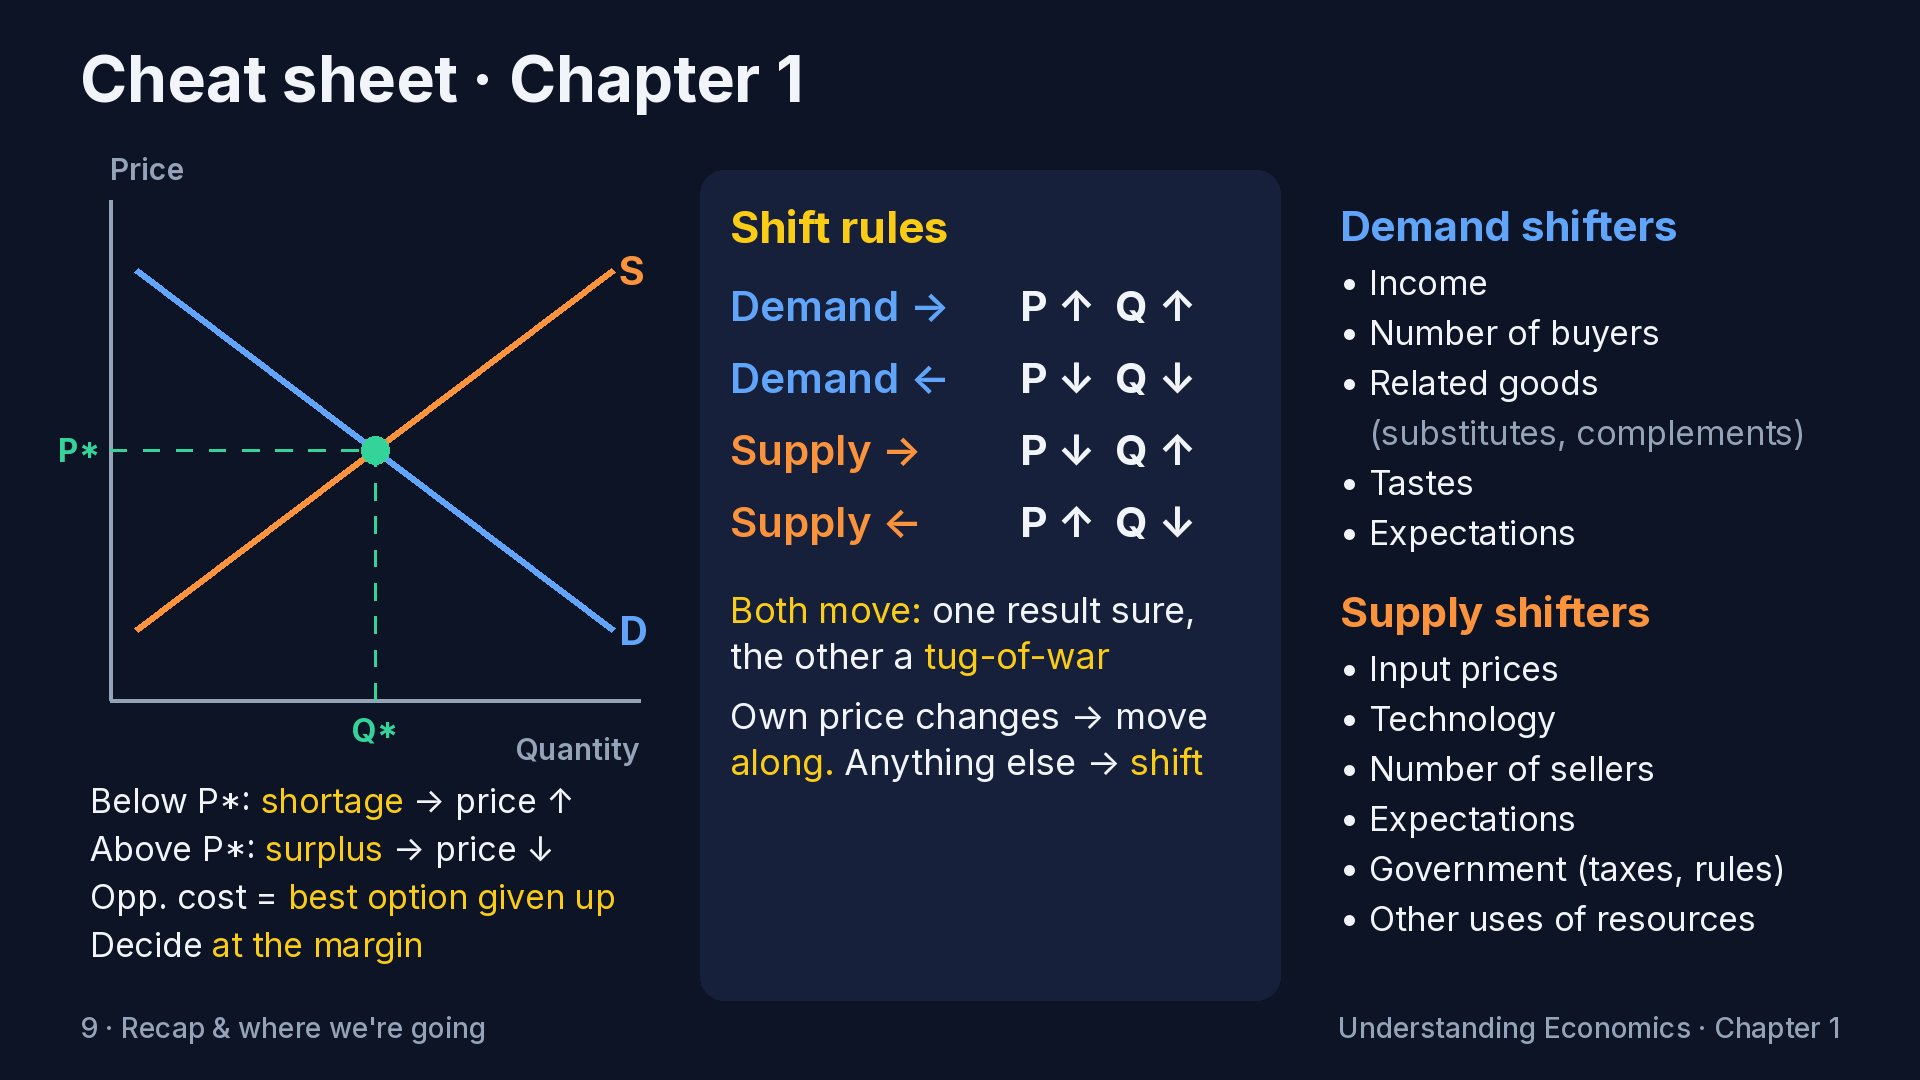
Section nine. Let's lock it in. Here's the whole chapter in six lines. Economics is the study of choices under scarcity. Micro zooms in on single markets. Macro zooms out to the whole economy. The real cost of any choice is the best thing you gave up: opportunity cost. And good decisions are made at the margin. The production possibilities frontier shows the menu of what's possible, and comparative advantage explains why trade lets everyone get more. Demand slopes down, supply slopes up. A change in the good's own price moves you along a curve. Anything else shifts the whole curve. Equilibrium is where they cross. A shortage pushes the price up, and a surplus pushes it down. And when a price is set below equilibrium, like those concert tickets, you get a sellout, and resale prices climb toward the market price. And when both curves move, one result is certain and the other is a tug of war. The bigger shift decides it. Here's your cheat sheet. Screenshot this one, or grab it from the slides on the course page. On the left, the core picture: demand, supply, and where they cross. In the middle, the shift rules: what each shift does to price and quantity. And on the right, the shifters for each curve. Any time a market confuses you, come back to this and run the four steps. Now three questions to check yourself. Pause after each one, answer out loud, then let it play. Question one. Gas prices rise sharply. What happens to the demand for bus rides, and why? Answer. Demand for bus rides shifts right. Driving and taking the bus are substitutes, and driving just got more expensive. So at every fare, more people want to ride the bus. If you said it's a movement along the curve, remember: only the bus fare itself moves you along the bus demand curve. Question two. This summer, strawberry prices fell, while more strawberries were sold than last year. What most likely happened? Answer. Most likely, supply increased, by more than any change in demand. Price down while quantity goes up is the signature of a supply shift to the right. Maybe the weather was great and farms had a bumper harvest. Demand might be perfectly normal. Question three. You skip a four-hour shift that pays fifteen dollars an hour, to go to a festival with free entry. What did the festival really cost you? Answer. Sixty dollars, the wages you gave up, assuming that shift was your next-best option. Free to get in isn't the same as free. And that's fine. If the festival was worth more than sixty dollars to you, it was a good choice. That's opportunity cost in one question. Here's where we're going. This course is six chapters, and today was the foundation. Chapter two goes deeper into how markets work: elasticity, price controls, taxes, and competition versus monopoly. Chapter three is when markets fail: pollution, public goods, hidden information, and wages. Then we zoom out. Chapter four is the whole economy: GDP, jobs, inflation, recessions, and government debt. Chapter five is money, the Federal Reserve, and interest rates. And chapter six covers trade, stocks and bonds, and real estate. That's chapter one. You now know how prices get made, including why concert tickets vanish in a minute. Next up, chapter two: how sensitive are buyers to a change in price, and what really happens when the government caps a price, sets a minimum, or adds a tax? See you there.
Downloads
Figures in this course are illustrative unless a source is cited. Real-world data reflects conditions as of November 2026. Narration is AI-generated.
Check your understanding
10 questions on Chapter 1. Pick an answer to see why; tap a section to jump the video there.