Growth, Employment & Inflation
Cheat sheet
Transcript
The puzzle
Welcome to Chapter 4 of Understanding Economics. In this chapter, we zoom out to the whole economy: how its size is measured, how jobs and unemployment are counted, and what inflation is. Then we'll look at recessions, and how government spending, taxes and the national debt fit in. Here's a puzzle. You turn on the news and hear that the economy is growing fast. Strong numbers, lots of jobs. Then you go to the grocery store, look at the receipt, and feel poorer than you did a year ago. Both things can be true at the same time. How? The answer isn't that the news is lying, or that you're imagining it. It's that "the economy" is being measured in a very specific way, and once you see how, the puzzle falls apart. By the end of this chapter you'll be able to read those headlines and know what they do and don't say about your own wallet.
Zooming out
For three chapters, we've been zoomed in. One market at a time: coffee, concert tickets, packaging, baristas. That's microeconomics. Now we zoom all the way out and look at the whole economy at once. That's macroeconomics. Macro mostly comes down to four questions. How much is the economy producing? Is it growing? Can people who want jobs find them? And are prices stable? One picture from Chapter 1 is the backbone for all of this: the circular flow. Households work for businesses and get paid. Then they spend that pay buying what businesses make. Your spending is someone else's income, and their spending is yours. Today we add one more player in the middle: the government. It takes money out of the loop as taxes, and puts money back in as spending, on things like roads, schools and defense, and as payments to people, like pensions and unemployment benefits. Keep this loop in mind. Almost everything in this chapter is about how fast money is moving around it.
GDP: measuring the whole economy
How do you measure the size of an entire economy? You can't add up apples, haircuts and phones directly. So economists turn everything into dollars and add those up. The result is gross domestic product, or GDP. GDP is the market value of all the final goods and services produced in a country over a period of time, usually a quarter or a year. Every word in that definition is doing a job, so let's take the important ones. "Market value" means we use prices. A car counts for more than a coffee because it sells for more. "Produced in a country" means it's about where things are made, not who owns the company. A car built in a factory in Ohio counts in American GDP, even if the company is based somewhere else. "In a period of time" means GDP counts what's newly made. A house built forty years ago and sold today doesn't count again. Neither does a used car. They were counted when they were new. And then there's the trickiest word: "final". Let's slow down on that one. Follow one loaf of bread, with made-up numbers. A farmer grows wheat and sells it to a miller for one dollar. The miller grinds it into flour and sells it to a bakery for two dollars. The bakery bakes it and sells you the loaf for four dollars. How much did this add to GDP? You might be tempted to add one plus two plus four and say seven. But that counts the wheat three times: once as wheat, again inside the flour, and again inside the bread. The wheat and the flour are intermediate goods. They get used up making something else. The bread is the final good. So the answer is four dollars, the price of the final product. There's a second way to get the same answer. Look at the value each step added. The farmer added one dollar. The miller turned a dollar of wheat into two dollars of flour, so it added one dollar. The bakery turned two dollars of flour into a four-dollar loaf, so it added two. One plus one plus two is four. Same answer. GDP is the sum of all the value added in the economy. Count the phone, not the chip inside it. Now, the most common way to measure GDP is to add up spending: who bought all those final goods and services. There are four kinds of buyers, and they make up the most famous formula in macroeconomics. C is consumption: everything households buy. Groceries, rent, haircuts, phones, streaming subscriptions. In the United States it's by far the biggest part of GDP. I is investment. Careful, because this doesn't mean what it means in everyday talk. In GDP, investment means businesses buying new equipment and buildings, like a bakery buying a new oven or a company building a warehouse. New homes count here too. Buying shares of a company is not investment in this sense. That's just one person swapping money for a piece of paper with another person. Nothing new got made. G is government purchases: what governments spend on goods and services. Teachers' salaries, road repair, military equipment. But not payments like pensions or unemployment benefits. Those are called transfer payments. The government is just moving money from some people to others, not buying anything new. That money gets counted later, when the people receiving it spend it. And NX is net exports: what we sell to other countries, minus what we buy from them. Exports add to GDP, because they're made here. Imports get subtracted. Why? Because when you buy an imported phone, it was already counted inside consumption, and it wasn't made here, so we take it back out. Let's run a tiny made-up economy. Households spend seven hundred dollars. Businesses invest a hundred and fifty. The government buys two hundred. This country exports a hundred dollars of stuff and imports a hundred and fifty, so net exports are minus fifty. Seven hundred plus a hundred and fifty plus two hundred, minus fifty: GDP is a thousand dollars. There's one more way to see it. Every dollar of spending is a dollar of income for someone: the workers, the owners, the landlords. So in principle, adding up all the spending and adding up all the income give you the same total. That's the circular flow again: your spending is someone else's income. Let's look at a real example. Here's what these numbers looked like in November 2026, when this course was made. They're here to show you how to read the numbers, so focus on what each one means. Start with growth. In the third quarter of 2026, the U.S. economy grew at an annual rate of three point four percent, according to the Bureau of Economic Analysis's first, or advance, estimate. Two things to know about that number. First, "at an annual rate" means it's the growth over three months, scaled up to what it would be if it kept going for a whole year. And second, it's an early estimate. These numbers get revised as more data comes in. And GDP has real limits. It counts what's bought and sold, so unpaid work, like cooking at home or caring for a family member, doesn't show up. It doesn't subtract pollution. It doesn't count leisure: if everyone worked fewer hours and were happier, GDP could fall. And it's a total. It says nothing about how the income is shared. To compare countries, economists usually divide by population and look at GDP per person, and they adjust for the fact that a dollar buys more in some countries than in others. GDP is a measure of output. It's useful, but it's not a measure of how well everyone is doing.
Real vs nominal
Here's a trap. Picture an economy that makes only pizzas. This year it makes a hundred pizzas, and they sell for ten dollars each. GDP is a thousand dollars. Next year it makes the exact same hundred pizzas, but the price has gone up to twelve dollars. Now GDP is twelve hundred dollars. Up twenty percent! But nobody's better off. There are exactly as many pizzas as before. The only thing that grew is the price tag. That's why economists split GDP into two versions. Nominal GDP is measured in each year's own prices. It goes up when we make more stuff, and also when prices go up. Real GDP is measured in fixed prices from one chosen year, so the effect of rising prices is taken out. Real GDP only goes up if we actually make more. Measure the second year at the first year's price, ten dollars, and real GDP is still a thousand. Real growth: zero. Now say in the third year the economy makes a hundred and five pizzas. Measured at the original ten-dollar price, that's ten-fifty. Real growth of five percent. That's actual growth: five more pizzas. This idea of "real" is one of the most important in the course, and it doesn't only apply to GDP. A real wage is your pay adjusted for prices. A real interest rate is an interest rate adjusted for inflation; that one shows up in Chapter 5. Any time you hear a number in dollars over time, ask: is that real, or nominal? There's a handy shortcut. Nominal growth is roughly real growth plus inflation. So real growth is roughly nominal growth minus inflation. And that's your first check. Pause and predict. Same quarter, same report. Nominal GDP, the dollar value of everything made, grew at an annual rate of about five point six percent. Compare that with the real growth number you just heard. Roughly how much of the growth was just prices going up? Pause, do the subtraction, then come back. The answer: about two percentage points, the gap between the two. So of the growth in the dollar value of everything we made, a bit more than half was more stuff, and the rest was higher prices. That's the shortcut working on real data. Keep it handy. We'll need it for the puzzle.
Jobs and unemployment
Now the second big question: can people who want jobs find them? You might think the unemployment rate is just the share of people without a job. It isn't, and the difference matters. Lots of people don't have a job and aren't trying to get one: retirees, full-time students, parents staying home with kids. It wouldn't make sense to call them unemployed. So economists sort adults into three groups. Employed: you have a job, full-time or part-time. Unemployed: you don't have a job, you're available to work, and you've actively looked recently. And not in the labor force: everyone else, people who don't have a job and aren't looking. The labor force is the first two groups together: everyone who's working or trying to. Let's do a small, made-up town. Two hundred adults. A hundred and twenty have jobs. Six don't have jobs and are looking. The other seventy-four are retired, in school, or not looking. The labor force is a hundred and twenty plus six: a hundred and twenty-six. The unemployment rate is the unemployed divided by the labor force: six out of a hundred and twenty-six, about four point eight percent. Notice we divide by the labor force, not by all the adults. And there's a second useful number: the labor force participation rate. That's the labor force divided by all adults: a hundred and twenty-six out of two hundred, sixty-three percent. It tells you what share of adults are in the game at all. Now here's a strange thing this setup produces. Suppose two of those six job-seekers get so discouraged after months of searching that they stop looking. They still don't have jobs. Nothing got better for them. But now they're counted as "not in the labor force", not as unemployed. So the unemployment rate falls, to four out of a hundred and twenty-four, about three point two percent. The headline number improved, and it was bad news. Those people are called discouraged workers. That's why the government also publishes broader measures. The headline rate is often called U-3. A wider one, U-6, also counts discouraged workers, people only loosely attached to the job market, and people working part-time who want full-time work. When the two measures move apart, it's telling you something. Here's a real case, from the October 2026 jobs report. The headline unemployment rate, U-3, fell, from four point two to four point one percent. Sounds like good news. But the broader U-6 rate climbed, from seven point six to seven point nine percent. So fewer people were counted as unemployed, while more people were stuck in part-time work they didn't want, or had drifted to the edge of the job market. Same month, two measures, two different stories. That's why it pays to look at both. That same October report showed employers adding about a hundred and sixty-five thousand jobs. The unemployment rate and the job count come from two different surveys: the rate from a monthly survey of households, and the job count from a survey of employers. Is an unemployment rate around four percent good? To answer that, you need to know that some unemployment is normal, even in a great economy. Economists sort it into three types. Frictional unemployment is people between jobs. Someone quits to find a better fit, or a graduate is looking for a first job. Searching takes time, and that's healthy. You want people to find good matches rather than grab the first thing. Structural unemployment is a mismatch. The jobs exist, but the workers don't have the skills for them, or live in the wrong place. Think of a factory town after the factory closes, while the new jobs are in software, three states away. This kind can last a long time. Cyclical unemployment is the kind caused by a slump in the whole economy. People stop spending, businesses sell less, and they lay workers off. This is the kind that rises in recessions, and it's the kind governments and central banks try to fight. When there's no cyclical unemployment, just the normal frictional and structural kinds, the economy is at what's called the natural rate of unemployment. It isn't zero, and nobody knows its exact value. It shifts over time, and economists argue about it. But it's the idea behind the question "is the job market too hot or too cold?"
Inflation
The third big question: are prices stable? Inflation is a rise in the overall level of prices. Not one price, like gas going up because of a storm. The general level: most prices, rising together. And the inflation rate is how fast that general level is rising, usually over a year. How do you measure "the general level of prices"? With a basket. Government statisticians survey what typical households buy, then track what that same basket costs over time. In the U.S., the best-known version is the Consumer Price Index, or CPI, from the Bureau of Labor Statistics. Let's do one with made-up numbers. Say the basket cost five hundred dollars in the starting year, which we call the base year. This year, the exact same basket costs five hundred and twenty. To turn that into an index, divide this year's cost by the base year's cost and multiply by a hundred: five-twenty over five hundred, times a hundred, is a hundred and four. The base year is always a hundred, by definition. So prices are four percent higher. If the index goes from a hundred and four to a hundred and eight the next year, inflation that year is about three point eight percent: the change, four, divided by where you started, a hundred and four. Measuring this is harder than it sounds. When prices of one thing jump, people switch to something cheaper, but a fixed basket doesn't switch. Products also get better: this year's phone does more than last year's, at the same price. And brand-new products take time to get into the basket. Statisticians adjust for these things, but none of the measures are perfect. There are also other price measures that use different baskets and weights. The U.S. central bank pays most attention to one called the PCE price index. You'll also hear about core inflation. That's inflation leaving out food and energy, whose prices bounce around a lot, so it gives a steadier read on the trend. Now prices. In September, the consumer price index was up about three point seven percent from a year earlier, and core prices, without food and energy, about two point six percent. That gap suggests a good share of the year's price pressure came from food and energy, the things people buy every week and notice most. So who gets hurt by inflation, and who doesn't? It depends on whose money is fixed. If your pay rises five percent and prices rise four, your real wage went up about one percent. You're a bit better off. If your pay rises two percent and prices rise four, your real wage fell about two percent, even though your paycheck got bigger. That's the most important way inflation reaches most people. Cash sitting in a drawer loses value every year. A pension or a payment fixed in dollars buys less over time. Lenders who lent at a fixed rate get paid back in dollars that buy less. And borrowers at a fixed rate are the flip side: they pay back in cheaper dollars. That's why some payments, like U.S. Social Security, are adjusted each year for inflation. It's called indexing. What about falling prices? That's deflation, and it sounds great, but it's usually a bad sign. If people expect prices to fall, they wait to buy, businesses sell less, and debts get harder to pay because the dollars you owe become worth more. That's why central banks usually aim for low, steady inflation, not zero. In the U.S. the target is about two percent a year. How they try to hit it is Chapter 5. One more thing about inflation, and it's a big one: expectations. If everyone expects prices to rise four percent next year, workers ask for raises of at least four percent, and businesses plan price increases of about four percent to cover their costs. So the expectation can help make itself come true. That's why central banks watch what people expect inflation to be almost as closely as inflation itself, and why they care so much about being believed. Hold that thought for Chapter 5. Now we can pay off the puzzle. Why can the economy grow fast while you feel poorer? Three reasons, and you now know all of them. One: the growth number is real GDP. Rising prices have already been taken out. It's saying the country made more stuff. It's not saying anything about whether your paycheck kept up with prices. Two: whether you feel richer depends on your real income, not the country's output. If prices rose more over the year than your pay did, your raise was a real pay cut, even in a growing economy. And the things that rose most, food and energy, are things you buy constantly, so you feel them more than an average does. Also notice, the two headline numbers don't even cover the same period. The GDP figure is the last three months, at an annual rate. The CPI figure is the last twelve months. And three, the one most people miss: lower inflation doesn't mean lower prices. If inflation drops from seven percent to three, prices are still rising, just more slowly. They don't go back to where they were. So the grocery receipt can feel worse for years, even after the inflation rate comes down, because you remember the old prices. The headline measures a rate of change. Your wallet feels the level. So neither the news nor your receipt is wrong. They're measuring different things.
Recessions and the business cycle
GDP doesn't grow smoothly. Over long periods it climbs, because populations grow and we get better at making things. But along the way it wobbles. Those wobbles are the business cycle. It has four parts. In an expansion, output grows, jobs are added, and unemployment falls. At the peak, the expansion runs out of steam. Then comes a contraction, when output falls and unemployment rises. A bad enough contraction is a recession. And the trough is the bottom, where things start to recover. Then the cycle repeats. It's called a cycle, but it's not regular at all. Expansions can last a year or more than a decade. Now one word on the trend itself, because over a lifetime it matters far more than any single recession. Why does output per person rise over time at all? Mostly because workers get more productive. They have better tools and machines, which economists call physical capital. They have more skills and training, the human capital from Chapter 3. And they have better ideas and technology: new ways of making things. Countries with stable laws, secure property rights and working institutions tend to do better at all three. Small differences in growth add up shockingly fast. Here's a handy shortcut called the rule of seventy. Divide seventy by a growth rate, and you get roughly how many years it takes for something to double. At one percent growth a year, incomes double in about seventy years. At two percent, about thirty-five. At three and a half, about twenty. That's the difference between living standards doubling roughly once in a lifetime and doubling every twenty years or so. You'll often hear that a recession is "two quarters in a row of falling GDP". That's a common rule of thumb, not the official definition. In the U.S., the official dates are set by a committee of economists at a private research group, the National Bureau of Economic Research. It looks at a broad set of measures, like jobs, income, spending and production, and calls a recession when there's a significant fall in activity across the economy that lasts more than a few months. It usually makes the call well after the fact, sometimes many months after the recession began. What causes recessions? There's no single cause, but most fall into two groups. The first is a drop in spending. Remember the circular flow. If households get nervous and cut back, or businesses stop investing, or a financial crisis makes it hard to borrow, then businesses sell less. They cut jobs. Those workers now have less to spend, so they cut back too. Spending falls, so income falls, so spending falls again. A drop in spending feeds on itself. The second is a supply shock: a sudden jump in the cost of making things. A big spike in oil prices raises costs for almost every business at once. A pandemic shuts factories and stores. Supply shocks are especially nasty, because they can cause rising prices and rising unemployment at the same time. That ugly combination has a name: stagflation. Can you see a recession coming? Not reliably, but economists watch what are called leading indicators: numbers that tend to turn before the whole economy does. New claims for unemployment benefits are one. If more people are filing every week, layoffs are picking up. Orders for new equipment are another, because businesses cut back on investment when they get nervous. Surveys of how confident consumers and businesses feel. And the stock market, which tends to move on expectations about the future. None of these is a crystal ball. Each one has sent false alarms. But when several turn down at once, people pay attention. Here's a simple way to hold all of this in your head. Think of potential output as the economy's speed limit: how much it can produce when workers and factories are fully but normally used. When spending pushes the economy above that speed limit, businesses can't keep up, they compete for scarce workers and materials, and inflation tends to rise. When spending falls short, you get idle workers and empty factories: unemployment rises. Much of economic policy is an attempt to keep the economy close to its speed limit, not too hot and not too cold.
Government spending, taxes & fiscal policy
So what can a government do about a recession? This is fiscal policy: using government spending and taxes to steer the economy. First, the basics. A national government takes in money mostly through taxes: taxes on people's income, payroll taxes taken out of paychecks, taxes on business profits, and smaller ones. In the U.S., big pieces of federal spending go to retirement and health programs, defense, and interest on the money it has borrowed, plus a long list of everything else, from roads to research. Now, steering. When the economy is in a slump, the government can use expansionary fiscal policy. It spends more, or cuts taxes, or both. More spending puts money straight into the circular flow. Tax cuts leave more money in people's pockets to spend. Either way, the aim is to replace some of the spending that disappeared. And it can spread. Say the government hires a company to fix a bridge. The company pays its workers. The workers spend some of that money at restaurants and stores. Those businesses pay their workers, who spend some of it too. So one dollar of new spending can end up adding more than one dollar to total spending. Economists call that the multiplier effect. How big it is in real life is one of the most argued-over questions in economics, and it depends a lot on the situation. In a deep slump, with lots of idle workers, it's likely bigger. When the economy is already at its speed limit, it's likely small. When the economy is overheating, the government can do the opposite: spend less or raise taxes, to cool things down. That's contractionary fiscal policy. It's much less popular, for obvious reasons, so governments use it less. Here's your second check. Pause and predict. A recession hits. Before lawmakers pass anything new, what happens all on its own to the taxes people pay? What happens to government payments like unemployment benefits? And does that help soften the recession, or make it worse? Pause, then come back. Here's the answer. When people lose jobs or earn less, they automatically pay less income tax, because they have less income. And more people automatically qualify for unemployment benefits and other support. So without anyone voting on anything, the government takes less money out of the loop and puts more back in. That softens the recession. And in a boom it works in reverse: tax payments rise and benefits fall, which cools things a little. These are called automatic stabilizers. They matter because the other kind of fiscal policy, the kind that needs a new law, has a big problem: timing. First someone has to notice the recession, and remember, the official call can come months late. Then lawmakers have to agree on what to do. Then the money has to actually get spent, and a bridge project can take years. By the time it all happens, the recession may be over, and the spending lands when the economy is already heating up. Automatic stabilizers skip all of that.
Deficits and the national debt
Now, how does a government pay for all this when spending is more than taxes? It borrows. And this is where two words get mixed up constantly, so let's get them straight. The deficit is a one-year number. If a government spends more than it takes in during a year, the gap is that year's deficit. If it takes in more than it spends, that's a surplus. The debt is the running total: all the past borrowing that hasn't been paid back yet. Think of a bathtub. The deficit is the water coming out of the faucet this year. The debt is the water already in the tub. A smaller deficit still adds water. It just adds it more slowly. The tub only gets emptier if the government runs a surplus. How does a government borrow? It sells bonds. A government bond is basically an IOU: you lend the government money today, and it promises to pay you interest and pay you back on a set date. In the U.S., these are Treasury bonds, and they're bought by people, pension funds, banks, foreign governments, and the central bank. A good chunk of the debt is also held by the government itself, in trust funds for programs like Social Security. Now the debt. In our November 2026 example, the Treasury's daily count put total federal debt at about forty and a half trillion dollars. Roughly four-fifths of it is held by the public: investors at home and abroad who bought Treasury bonds. The rest is held by the government's own accounts, like the Social Security trust funds. Forty trillion dollars is a number so big it's almost meaningless on its own. So how do you tell whether a debt is a problem? Economists usually compare it to the size of the economy: debt divided by GDP. The idea is the same as for a household. A hundred thousand dollars of debt means one thing if you earn thirty thousand a year and something very different if you earn three hundred thousand. What matters is the debt compared with the income available to support it. I'm not going to put a number on this ratio here, because the figures for it vary by source and method. It's easy to look up from an official source, and the trend matters more than any single reading. So is government debt bad? The honest answer is that it depends what it's for, and how big it gets. Borrowing can make sense in a recession or an emergency, when it keeps the economy from falling further. It can make sense for things that pay off for decades, like infrastructure or research, the way a household might borrow for an education. But there are real costs. The bigger the debt, the more the government has to pay in interest every year, and that money can't go to anything else. If interest rates rise, those payments rise too, as old bonds get replaced with new ones at higher rates. High debt can also leave less room to respond to the next crisis. And when a government borrows a lot, it's competing with businesses and households for the same pool of savings, which can push interest rates up for everyone. That last idea is called crowding out, and it's one of the things we'll pick up in Chapter 5, because it runs through interest rates. Unlike a household, a large national government doesn't usually have to pay off its debt completely. Many governments have carried debt for a very long time. What matters is whether the debt is growing faster than the economy that supports it, and whether lenders stay confident they'll be repaid.
Recap, cheat sheet & self-check
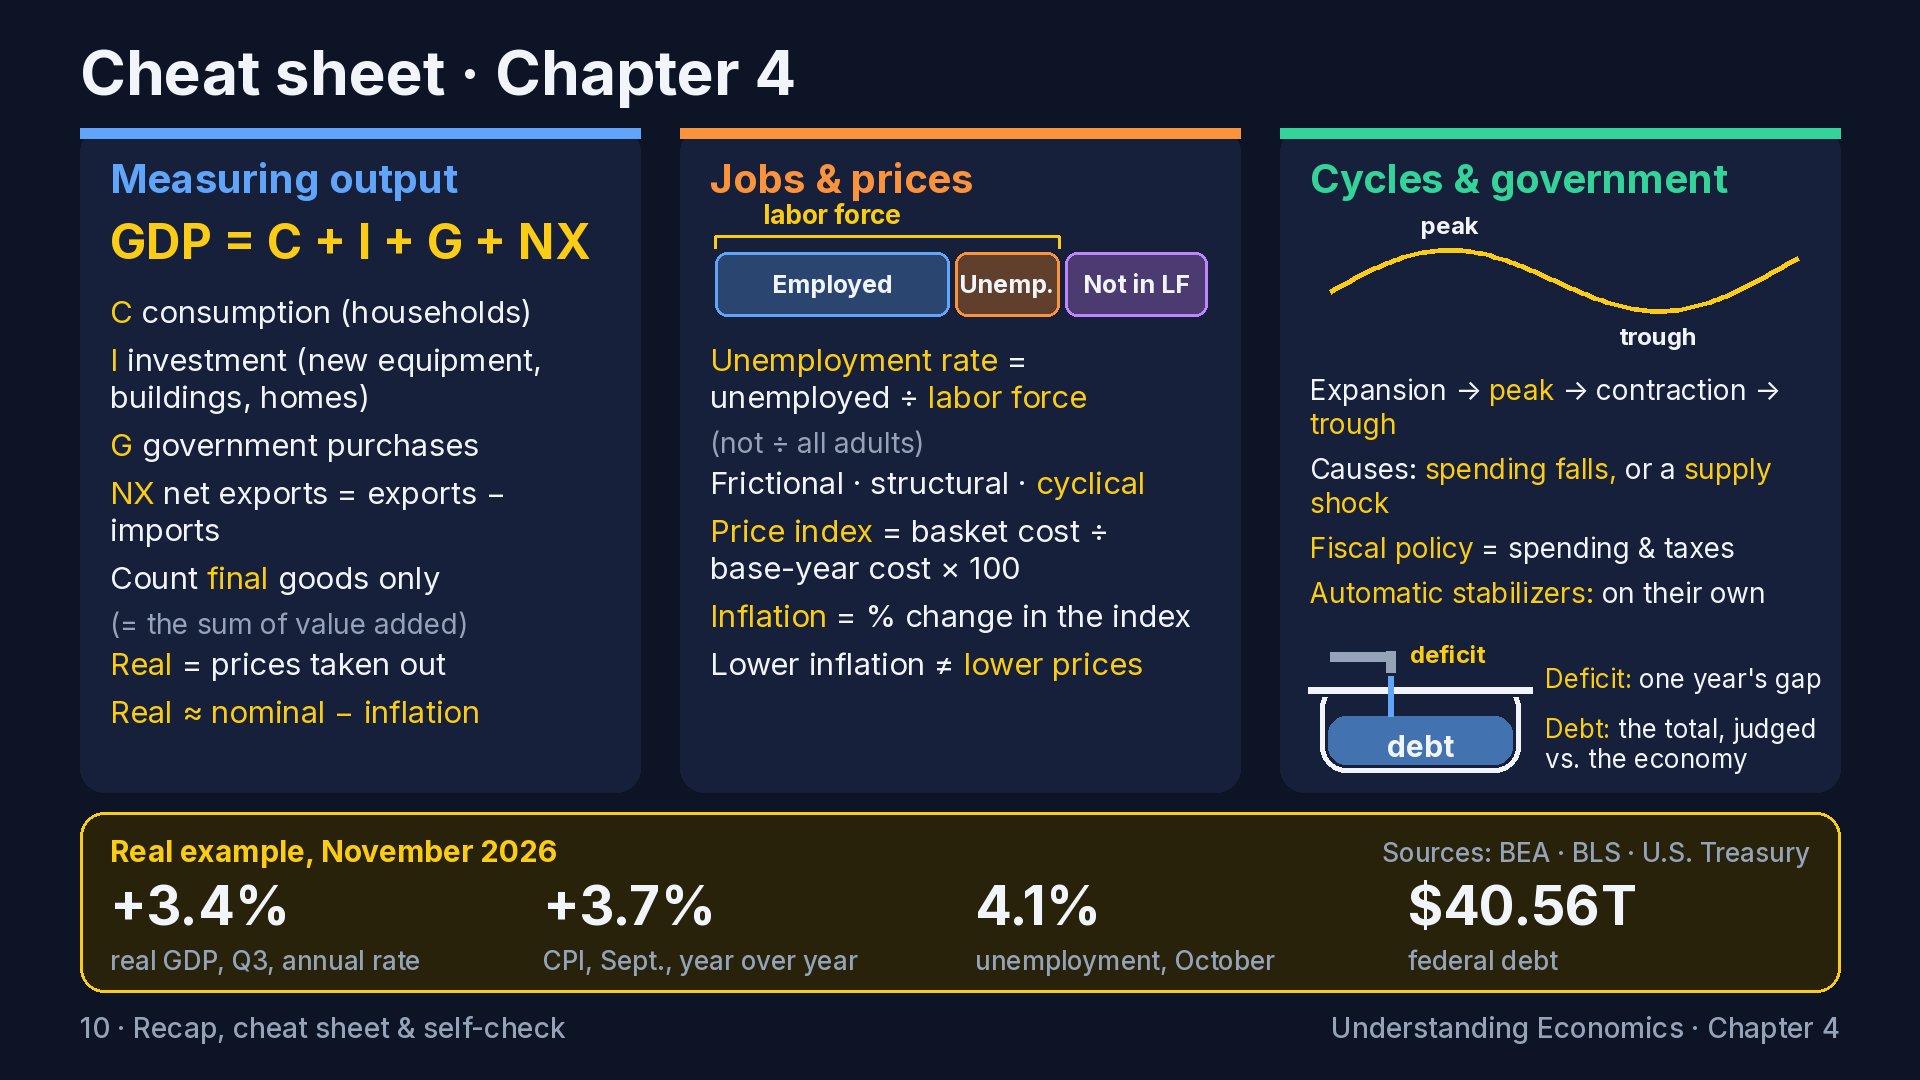
Let's lock it in, in six lines. GDP is the market value of all final goods and services made in a country. Count the final product, not the parts. By spending, it's C plus I plus G plus net exports. Nominal numbers use today's prices. Real numbers take inflation out. Real growth is roughly nominal growth minus inflation. The unemployment rate is the unemployed divided by the labor force, not by all adults. Some unemployment is normal: frictional and structural. Cyclical unemployment is the recession kind. Inflation is the rise in the general price level, measured with a basket like the CPI. It hurts people whose money is fixed and helps fixed-rate borrowers. A lower inflation rate means prices rise more slowly, not that they fall. The business cycle runs expansion, peak, contraction, trough. Recessions come from falling spending or from supply shocks. Fiscal policy is government spending and taxes. Automatic stabilizers kick in on their own. The deficit is one year's gap. The debt is the total, best judged against the size of the economy. Here's your cheat sheet. On the left, how GDP is built and the real-versus-nominal shortcut. In the middle, how unemployment and inflation are measured. On the right, the business cycle and the deficit-and-debt bathtub. And along the bottom, the November 2026 real example. Those numbers are there to practice on. How they're built is the part that carries over to any year. Now three questions to check yourself. Pause after each one, answer out loud, then let it play. Question one. A family buys a brand-new car made in Japan, and a used car from a neighbor. What happens to U.S. GDP? Answer. Neither purchase adds to U.S. GDP. The new car counts as consumption, but because it's an import, it's also subtracted in net exports, so it cancels out. It was made in Japan, so it's part of Japan's GDP. The used car was counted when it was new. Swapping it between people doesn't create anything new. If a dealer earned a fee for arranging either sale, that service would count, but the cars themselves don't. Question two. Last year you earned fifty thousand dollars. This year you got a raise to fifty-one thousand, and prices rose four percent. Are you better or worse off? Answer. Worse off. Your pay went up two percent, but prices went up four, so your real wage fell by about two percent. You have more dollars, and each one buys less. This is the opening puzzle in a single paycheck. Question three. A country's unemployment rate falls from six percent to five percent, but in the same year, the number of people with jobs doesn't change at all. How could that happen, and is it good news? Answer. Probably not good news. If the number of people with jobs didn't rise, the rate most likely fell because some unemployed people stopped looking and left the labor force. Discouraged workers aren't counted as unemployed. You'd want to check the participation rate, or a broader measure like U-6, before celebrating. That's Chapter 4. You can now read the economy's big scoreboard: output, jobs and prices, and you know what recessions are and what governments do about them with spending, taxes and debt. But there's one huge player we haven't met yet. The one that sets interest rates, and that people mean when they say "the Fed". In Chapter 5 we cover what money actually is, how banks create it, what the central bank does, and why interest rates move, including the one on your mortgage, your car loan and your savings account. See you in Chapter 5.
Downloads
Figures in this course are illustrative unless a source is cited. Real-world data reflects conditions as of November 2026. Narration is AI-generated.
Check your understanding
10 questions on Chapter 4. Pick an answer to see why; tap a section to jump the video there.